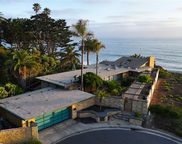
Welcome to the Walker Real Estate Group blog: your local resource for South Orange County real estate. 🏡 Every week we publish in-depth guides to San Clemente, Dana Point, and San Juan Capistrano, covering neighborhood-by-neighborhood breakdowns, current market data, and what it all means for buyers and sellers. You'll also find our monthly "Sold in South OC" report, tracking real sale prices and trends across all three cities. Whether you're buying your first home, selling, or just want to know what your property is worth, the goal is simple: clear local information you can act on.

Nov. 4, 2026

Buying a Condo in San Juan Capistrano in 2026: What First-Time Buyers Need to Know (From a $944,903 Median Condo Price to 7.24% Rates)

Spanish colonial style condominium building in San Juan Capistrano with terracotta roofs and lush landscaping on a clear day

Summary: Condos and townhomes can be a more attainable way to buy in San Juan Capistrano than a single-family home. Redfin reported a $944,903 median condo/co-op sale price compared with $1,989,207 for single-family homes for the three-month period ending September 2026. Freddie Mac’s national 30-year fixed mortgage average was 7.24% for the week ending October 29, 2026. Your actual price, loan rate, and monthly costs will depend on the property and your financing. 🏡

Why condos can be an entry point in San Juan Capistrano 📍

San Juan Capistrano has a wide range of home types and prices. For many first-time buyers, an attached home may offer a lower purchase price than a single-family property while keeping them in the local market.

Recent market figures, not condo-specific unless noted:

  • Redfin: The overall median sale price was $1,410,828, up 3.4% year over year, with a median of 49 days on market and 193 active listings, for the three-month period ending September 2026.
  • Redfin by property type: Median sale prices were $944,903 for condos/co-ops and $1,989,207 for single-family homes over the same period.
  • Realtor.com: October 2026 data reported a $1,825,000 median sold price, 57 median days on market, and a 99% sale-to-list ratio.

These sources use different methods and reporting periods, so their figures are not directly interchangeable. Redfin’s property-type figures cover a three-month period; Realtor.com’s October figures describe a different snapshot of the market. Neither citywide days-on-market measure describes how quickly an individual condo will sell.

As a general search range, attached homes may appear between $700,000 and $1,000,000, depending on location, size, condition, and current inventory. Buyers looking for comparatively attainable options often include Village San Juan, Alipaz, and Mesa Verde in their searches. HOA dues vary by community and can affect your monthly budget, so compare the services and costs for each property.

What a 7.24% rate means for your budget 💳

Freddie Mac’s 7.24% 30-year fixed weekly average for the week ending October 29, 2026, is a national benchmark, not a personalized loan quote. It was down from 7.32% the prior week and 7.40% two weeks earlier.

Illustration only, not a quote or financial advice: At the Redfin median condo/co-op price of $944,903, a 10% down payment would be $94,490.30, leaving an estimated loan amount of $850,412.70. At 7.24% for 30 years, estimated principal and interest would be about $5,795 per month.

This simplified example excludes property taxes, homeowners insurance, mortgage insurance, HOA dues, and other costs. Your payment will depend on your loan terms and financial profile. Ask a lender for a personalized quote and a complete monthly cost estimate.

Down payment assistance for eligible buyers 🌱

The CalHFA MyHome Assistance Program offers a deferred-payment junior loan for eligible first-time buyers. Assistance may be up to the lesser of:

  • 3.5% of the purchase price or appraised value with a CalHFA FHA loan.
  • 3% of the purchase price or appraised value with a CalHFA Conventional loan.

MyHome is a loan, not a grant, and eligibility depends on program and lender requirements. CalHFA’s stated borrower requirements include first-time homebuyer status, occupying the property as a primary residence, completing an approved homebuyer education and counseling course, and meeting CalHFA income limits. Applications go through a CalHFA-approved lender, and condominiums must meet the guidelines of the first mortgage (CalHFA MyHome Assistance Program page, accessed November 2026).

For new reservations received on or after June 30, 2026, CalHFA lists an Orange County income limit of $274,000 for all CalHFA first-mortgage and subordinate-mortgage programs, excluding Dream For All (CalHFA Program Bulletin 2026-07, dated June 25, 2026).

The separate California Dream For All Shared Appreciation Loan, which offers up to 20% of the purchase price for down payment or closing costs (not to exceed $150,000) for eligible first-generation buyers, is a voucher-based program and its application portal is currently closed; new voucher rounds have not been announced. Its 2026 Orange County income limit is $219,000, effective June 30, 2026 (CalHFA Dream For All program page and income limit tables, accessed November 2026). Ask a CalHFA-approved lender to confirm current program availability.

Condo and townhome buyer checklist ✅

Shared-wall ownership works differently from a detached house, and the checks below focus on what matters most for attached homes in San Juan Capistrano.

Before you make an offer:

  1. Get pre-approved. Preparation can help you act when a suitable property is available. Recent citywide market reports showed 49 days on market from Redfin and 57 from Realtor.com; those figures are not condo-specific.
  2. Compare HOA dues and coverage. Review what the dues include and how they affect your total monthly costs.
  3. Read the HOA documents. Check rules, financial information, maintenance responsibilities, and rental restrictions that could affect future flexibility.
  4. Budget for insurance and assessments. Understand the coverage you need and ask about any current or proposed special assessments.
  5. Use matched comparable sales. Compare similar condos or townhomes by location, size, condition, and features, not single-family sales alone.
  6. Confirm loan and property eligibility. Your lender can assess whether the condo project meets your loan program’s requirements.

Buyer takeaways: choose your next step 🔎

A focused search, clear monthly budget, and review of the HOA documents can help you compare options with confidence. You can also explore the home-buying process as you prepare. 🗝️

Frequently asked questions ❓

Is San Juan Capistrano affordable for first-time buyers?

It can be a more attainable option than buying a single-family home, especially if you are open to condos or townhomes. However, affordability depends on your budget, financing, HOA costs, and the available properties.

What is the median condo price in San Juan Capistrano?

Redfin reported a $944,903 median condo/co-op sale price for the three-month period ending September 2026. This is a market median, not a guaranteed price for a particular home.

What assistance programs can first-time buyers in California use?

Eligible buyers may consider CalHFA’s MyHome Assistance Program, which offers up to 3.5% (FHA) or 3% (Conventional) of the purchase price or appraised value as a deferred-payment junior loan. The separate California Dream For All Shared Appreciation Loan is voucher-based and currently closed to new applications. Confirm current availability and eligibility with a CalHFA-approved lender.

What should condo buyers check before making an offer?

Review HOA dues and coverage, association rules and financial documents, rental restrictions, insurance needs, possible assessments, comparable condo sales, and whether the property meets lender requirements.

Data sources 🔗

  • Redfin San Juan Capistrano housing market (via Redfin data center): Three-month period ending September 2026; medians cover homes sold in overlapping three-month windows, and property-type samples vary in size (31 condo/co-op sales, 61 single-family sales in the latest period).
  • Realtor.com San Juan Capistrano market data: October 2026.
  • Freddie Mac Primary Mortgage Market Survey (PMMS): U.S. weekly averages as of October 29, 2026 (30-year FRM at 7.24%, down from 7.32% on October 22 and 7.40% on October 15, 2026).
  • CalHFA MyHome Assistance Program page: Program terms, borrower requirements, and eligibility, accessed November 2026.
  • CalHFA Single Family Lending Program Bulletin 2026-07: Dated June 25, 2026; 2026 income limits effective for new reservations received on or after June 30, 2026.
  • CalHFA California Dream For All Shared Appreciation Loan program page: Program highlights, voucher status, and 2026 income limits effective June 30, 2026, accessed November 2026.

Chris Walker, Realtor with Walker Real Estate Group / Search SoCal Property, is available to help you compare options and navigate your purchase in San Clemente, Dana Point, and San Juan Capistrano. You can get support as you search, evaluate a property, and move through the buying process. 🤝

Nov. 3, 2026

San Clemente Fall Market Update: Homes Go Under Contract in 14 Days at 98.2% of List as Rates Ease to 7.24%

San Clemente Fall Market Update: Homes Go Under Contract in 14 Days at 98.2% of List as Rates Ease to 7.24%

Market takeaway: San Clemente remains the fastest-clearing market on the South Orange County coast, with 2.3 months of supply and a typical home going under contract in 14 days. But 43% to 45% of active listings have had price cuts, and mortgage rates remain high despite a recent decline. For sellers, pricing correctly from day one matters. For buyers, previously reduced listings may offer more room to discuss price and terms. 📊

At a glance 📌

Indicator Latest reported figure
12-month median sale price $1,795,000, up 4.1%
Closed sales in the last 12 months 631, down 0.9%
Typical time to contract 14 days
Sale-to-original-list price 98.2%
Active listings 120
Months of supply About 2.3
Buyers who paid cash 37%
Freddie Mac 30-year fixed weekly average 7.24% for the week ending October 29, 2026

The citywide closed-sale figures and inventory are from Realatrends’ CRMLS-based market data, updated November 2, 2026. The mortgage figure is Freddie Mac’s national weekly benchmark, not a San Clemente-specific quote.

The fall split: tight supply, selective pricing 🍂

The headline figures describe two parts of the same market. San Clemente’s limited supply and quick-moving, well-priced homes support sellers. Meanwhile, price reductions and high borrowing costs show that buyers are still watching value closely.

In the 12 months to November 2, the median sale price reached $1,795,000, compared with $1,725,000 in the prior 12 months. The median sale price over the most recent 90-day period was $1,837,000 through October 26. Homes sold for a median $810 per square foot, up from $790 a year earlier.

The typical home went under contract in 14 days, compared with 21 days a year earlier. Across sales, the sale-to-original-list price was 98.2%, versus 97.6% a year earlier. 25% of sales closed above original list, up from 23% a year earlier.

That speed applies to homes that sold; it does not mean every listing moves quickly. Separate sources show significant price-cut activity among current listings. Pacific Sotheby’s October market report put the share of active San Clemente listings with at least one cut at 43% as of its October 1 snapshot. Topfind Realty’s November update counted 54 of 120 active listings, or 45%, with a reduced price; its reported average reduction was 6.4% (~$131,000). These are different source snapshots and measures, so they should be read separately.

Rates eased but affordability remains a factor. Freddie Mac’s 30-year fixed-rate mortgage averaged 7.24% for the week ending October 29, down from 7.32% the prior week and 7.40% two weeks earlier. A weekly national average is a benchmark; an individual loan offer can differ based on borrower and loan details.

What the separate data sets show 📈

CRMLS closed sales and inventory

In the last 12 months, 631 homes sold, compared with 637 in the prior 12 months. October 2026 recorded 45 closings, following 55 in September, 61 in August, 70 in July, and 62 in June.

Year to date through November 2, San Clemente recorded 545 sales at a median price of $1,775,000, up 0.3% versus 2025. As of November 2, the market had 164 homes for sale, including 120 Active listings, with about 2.3 months of supply. 37% of buyers paid cash.

Property type Sales, last 12 months Median sale price Year-over-year price change Median price per sq. ft. Days on market Sale-to-list Cash buyers
Single-family 449 $1,989,000 +8.5% $820 11 days 98.2% 38%
Condos/townhomes 148 $1,099,000 +4.7% $774 16 days 98.5% 34%

Source: Realatrends, CRMLS sales data updated November 2, 2026. Figures are cited by name and date rather than linked, so every link on this page stays on searchsocalproperty.com.

ZIP code snapshots

ZIP code Sales, last 12 months Median sale price
92672 344 $1,800,000
92673 286 $1,770,999

These are ZIP-level sales summaries, not neighborhood boundaries. A particular home’s location and comparable sales provide more useful context than ZIP alone.

Market time: city, coast, and county

The Pacific Sotheby’s October report measured San Clemente’s expected market time at 84 days as of October 1, down from 109 days a year earlier. It was 66 days at the start of August, indicating a slower fall pace than late summer. The same coastal comparison reported 117 days for San Juan Capistrano and 173 days for Dana Point. By this measure, San Clemente was clearing supply fastest among these South OC coastal markets.

The report also showed 101 active single-family listings in September, down from 130 a year earlier, and 2.7 months of single-family supply. September’s 55 closings across all types averaged 100.0% of last asking price; none closed above $5 million. Single-family homes that closed in September had gone under contract in a median of 12 days. These figures use a different time period and measure than the trailing-12-month Realatrends numbers above.

For broader context, Orange County’s expected market time was 122 days on October 26, 2026, up 4 days over two weeks and in buyer’s-market territory under that report’s definition. Countywide, there were 4,948 active listings and 1,219 pending sales in the prior 30 days. In the $2M–$2.5M price band, relevant to many San Clemente homes, expected market time was 154 days, compared with 106 days a year earlier. County figures provide context, not a direct substitute for San Clemente data.

Local context: city planning areas and ZIPs 🏘️

The City of San Clemente identifies its official Specific Plan areas below. These planning areas are useful local reference points, but they are not a complete directory of every subdivision or real estate neighborhood.

City-recognized planning area
Forster Ranch
Marblehead Coastal
Marblehead Inland
Pier Bowl
Rancho San Clemente
Talega
West Pico Corridor

Marblehead: The City identifies separate Marblehead Coastal and Marblehead Inland planning areas. A home’s exact location within the area, condition, and nearby comparable sales matter when assessing value.

Rancho San Clemente: This is another City-recognized Specific Plan area. For a property-level location check, consult the City’s Specific Plans and Community Maps resources.

Buyer takeaways 🏠

  • Get ready before touring. At a 14-day typical time to contract, a well-priced home may move quickly. Confirm your budget and financing with your lender.
  • Focus negotiation where the listing signals room. Review homes with recorded price cuts and longer marketing periods. A reduction is a reason to investigate, not a guarantee of a particular discount.
  • Compare the right homes. Single-family homes and condos/townhomes have different median prices and selling patterns. Use relevant property-type and location comparisons.
  • Account for rates in your payment plan. The 7.24% Freddie Mac benchmark eased week over week, but it remains important to model your payment using a current lender quote.

🔎 Search San Clemente homes for sale · 📋 View recently sold listings

Seller takeaways: set the opening price with care 🎯

The market supports well-positioned listings, but the price-cut data is a reminder that buyers are comparing options. With 43% of active listings showing a cut in one report and 45% in another, the original asking price deserves careful attention. The sale-to-original-list figure of 98.2% is a trailing-12-month measure; it does not guarantee the result for an individual home.

Before listing, compare recent sales with your home’s location, condition, property type, and features. A clear pricing plan can help you reach buyers early, while the listing is new and attention is strongest. 📍

Request a home value review

Frequently asked questions ❓

1. What is the median sale price in San Clemente?

The 12-month median sale price was $1,795,000 as of November 2, 2026, up 4.1% from $1,725,000 in the prior 12 months, according to Realatrends’ CRMLS-based data.

2. How quickly are San Clemente homes going under contract?

The typical home went under contract 14 days after listing in the last 12 months, compared with 21 days a year earlier. September single-family closings had a separate median of 12 days to contract in the Pacific Sotheby’s report.

3. Are San Clemente homes selling at asking price?

The trailing-12-month sale-to-original-list ratio was 98.2%. Separately, September closings averaged 100.0% of last asking price in the Pacific Sotheby’s report. These measures use different periods and list-price definitions.

4. How much inventory is available?

Realatrends reported 164 homes for sale, including 120 Active listings, and about 2.3 months of supply as of November 2, 2026.

5. What does a 7.24% mortgage rate mean for buyers?

It is Freddie Mac’s national average for a 30-year fixed-rate mortgage for the week ending October 29, 2026. It was down from 7.32% the prior week and 7.40% two weeks earlier. Your actual rate may differ; ask a lender for a personalized quote.

About this data 🔗

This update combines independent sources with different report dates, samples, and definitions. Realatrends reports CRMLS closed-sale and listing data updated November 2, 2026. Pacific Sotheby’s figures are from its October 2026 market report, including a snapshot as of October 1 and September closings. Topfind Realty’s price-cut figures are its November 2026 update. Freddie Mac’s 7.24% is a national weekly mortgage benchmark for the week ending October 29. Orange County figures come from Reports on Housing / Steven Thomas, dated October 26, 2026. Use each source’s period and methodology when comparing figures.

Fall can bring serious, less seasonal buyers to the market ahead of the holidays. Whether you are preparing to sell, comparing homes, or planning your next step, Chris Walker and Walker Real Estate Group are available to help you review the local information and move forward at your pace. 🤝

Oct. 28, 2026

Mortgage Rates at 7.32%: What South Orange County Buyers and Sellers Should Know (October 2026)

Mortgage Rates at 7.32%: What South Orange County Buyers and Sellers Should Know (October 2026)

Aerial view of the San Clemente Pier, coastline, and surrounding homes beneath a bright blue sky

Summary: The NATIONAL 30-year fixed mortgage rate averaged 7.32% for the week ending October 22, 2026-the first drop in two months. NATIONAL purchase mortgage applications then increased 4% for the week ending October 23, their first weekly increase in seven weeks. For you, these are modest signs of rate relief and renewed buyer activity, not a local South Orange County rate quote or proof of a broad demand surge. Buyers should plan around a lender’s current payment estimate; sellers should price for today’s market and buyer budgets. 🏡

The October rate snapshot 📊

NATIONAL, Freddie Mac: The average 30-year fixed mortgage rate was 7.32% for the week ending October 22, 2026. Freddie Mac characterized it as the first decline in two months. This is a national survey average, not a personalized quote or a rate specific to San Clemente, Dana Point, or San Juan Capistrano. Your actual terms depend on your loan and lender. Freddie Mac’s weekly survey and Realtor.com’s report provide the rate context.

NATIONAL, Mortgage Bankers Association: Purchase applications increased 4% for the week ending October 23, 2026. It was the first weekly increase in seven weeks, according to the MBA survey published October 28. Applications indicate people seeking purchase loans; they do not establish how many home sales will close or measure demand in a particular South Orange County city. Read the MBA survey.

NATIONAL, Realtor.com weekly housing trends: For the week ending October 17, 2026, the median listing price was $415,000, down 2.1% year over year; median time on market was 62 days; and active inventory grew 7.7% year over year. These are national figures, not local South Orange County market statistics. They provide broader context only. See the weekly report.

A separate CNBC report on October 28 said rates fell for a second straight week. Rate reports can differ in survey method and timing, so use the source and period attached to each figure. 📌

What this means for South Orange County 🏠

A national average cannot tell you the rate or payment you will receive here. It can, however, frame the financing climate. In South Orange County, where buyers may be weighing coastal living in San Clemente and Dana Point alongside the different setting and home choices of San Juan Capistrano, financing remains part of the decision, not a separate detail to consider after you find a home. If you have been watching the Orange County real estate market this fall, here is what this rate environment can mean for your next move.

The same rate movement may affect buyers differently. A first-time buyer may be watching the total monthly housing cost closely. A move-up buyer may be balancing a new loan against the proceeds and timing of a current-home sale. Sellers, meanwhile, should expect many buyers to compare each property with care and consider what the payment means for their own budget.

Local lifestyle and property details vary from home to home. A national rate or housing report does not establish a local listing price, days on market, or demand level. For a grounded view of your options, compare the specific homes and recently sold properties relevant to your search. 🔎

Wide view of Dana Point Harbor and sailboats along the South Orange County coastline

Buyers: Plan around the payment you can afford 💡

At 7.32%, a small rate change can affect the principal-and-interest portion of your monthly payment. The impact depends on the loan amount and terms, among other factors. Your complete housing costs also include items such as property taxes and insurance. Ask a lender to estimate the full payment for the home and financing you are considering; avoid relying on a national average as a personal quote.

Before you tour:

  • Set your comfort range. Decide what monthly cost fits your budget, rather than basing your search only on a maximum loan amount.
  • Get a current lender estimate. Discuss available loan options, costs, and rate-lock terms directly with a lender.
  • Revisit the numbers as you narrow your search. A different property or loan structure may change your estimated payment.
  • Keep future rate changes in perspective. Make a decision based on financing you can manage now, rather than assuming rates will move in a particular direction.

If you are a first-time buyer, you can start with a clear budget and lender conversation before you begin browsing San Clemente homes for sale and the rest of our South Orange County real estate listings. If you are planning a move-up purchase, review how your current home sale, timing, and new financing fit together. The home-buying process is easier to assess when those pieces are considered together. ✅

What does the 4% application increase signal? 📈

The NATIONAL 4% increase suggests that some prospective buyers responded to the recent easing in rates by applying for purchase financing. The first weekly increase in seven weeks is a change in direction, but it is only one weekly reading. It does not show that buyer demand has fully returned, and it does not tell you how many applications will become accepted offers or completed purchases.

For buyers, it may be a reason to stay prepared if you are already considering a move: keep your financing information current and be ready to compare suitable listings. It is not a reason to rush into a purchase that does not fit your needs or budget.

For sellers, treat the figure as national context, not evidence that a specific local home will attract more showings or offers. Property condition, location, pricing, and the terms buyers can manage all matter in an individual sale. 🧭

Sellers: Price for today’s buyer 🏡

When borrowing costs shape a buyer’s budget, your pricing strategy should reflect the home’s current competition and relevant nearby sales, not a national median listing price. A thoughtful review of comparable properties can help you understand how buyers may assess your home and where its features fit in the local market.

Consider the presentation and terms together with price. Clear listing information, strong preparation, and a plan for reviewing buyer feedback can help you respond as the market speaks. If a buyer raises a request related to financing or closing terms, review the proposal in the context of your goals and the full offer.

For a starting point, request a free home valuation and compare it with recently sold listings. These are useful steps toward a property-specific conversation; national statistics cannot determine the value of an individual home. 🌿

Entrance arch to Dana Point’s Lantern District with homes and palms in the background

Frequently asked questions ❓

Is 7.32% the mortgage rate I can get in South Orange County?

No. It is Freddie Mac’s NATIONAL average for the 30-year fixed mortgage for the week ending October 22, 2026. Your lender can provide a current estimate based on your application and loan details.

Should I wait for mortgage rates to fall further?

No one can reliably determine from these reports what rates will do next. Consider your budget, timing, and housing needs using a current lender estimate. Make your decision based on terms you can manage rather than a rate forecast.

How does a 7.32% rate affect my monthly payment?

The interest rate affects the principal-and-interest portion of your payment. The loan amount and terms also matter, and your total housing cost includes other expenses. Ask a lender to model the payment for your specific situation; no single national average can provide that estimate.

Does the 4% rise in purchase applications mean demand is surging locally?

No. The NATIONAL increase was a weekly change in purchase applications and the first increase in seven weeks. It does not prove a local surge or predict the outcome for a particular listing.

What should I focus on if I’m selling?

Review nearby comparable sales, competing listings, your home’s condition, and buyer feedback. A free valuation and recent-sale review can help you start a property-specific pricing discussion.

Do the national housing trends describe San Clemente, Dana Point, or San Juan Capistrano?

No. The Realtor.com figures cited above are NATIONAL data. They do not establish city-level prices, inventory, or selling timelines. For local context, focus on current listings and comparable sales for the area and type of property you are considering.

Search, compare, or request guidance 🤝

For help understanding how rates and buyer activity may affect your plans, contact Chris Walker, a San Clemente real estate agent with Walker Real Estate Group. Chris and the team are available to help you review your options and take the next step at your pace. 📍

Citations and data sources 🔗

Oct. 26, 2026

Sold Homes in South OC: October 2026 Real Estate Sales Report for San Clemente, Dana Point & San Juan Capistrano

Sold in South OC: October 2026 Real Estate Sales Report for San Clemente, Dana Point & San Juan Capistrano

Aerial view of the San Clemente Pier and South Orange County coastline at sunset

📅 Report period: October 2026
📍 Coverage: San Clemente, Dana Point, and San Juan Capistrano
🏢 Prepared by: Walker Real Estate Group / Search SoCal Property

📊 October 2026 at a glance

October’s city snapshots show median sold prices of $2,112,500 in San Clemente, $2,415,000 in Dana Point, and $1,825,000 in San Juan Capistrano. Active listings ranged from 125 to 195 across the three cities.

Countywide, Orange County’s expected market time reached 118 days in the October 12 report, while a separate Southern California weekly update put that region’s expected market time at 149 days. These figures use different reporting areas and should not be combined. 📈

Meta and source notes

City-level figures below are from Realtor.com October 2026 data. County indicators are from the Orange County Housing Report dated October 12, 2026. Southern California weekly figures and Freddie Mac mortgage rates are presented separately.

📊 Countywide indicators

Orange County Housing Report, October 12, 2026

  • 4,924 active listings, down 28 homes (0.6%) over two weeks and 9% year over year.
  • Inventory was 28% below the 2017–2019 pre-COVID average.
  • 1,249 pending sales over the prior month, down 100 (7%) over two weeks and 21% year over year. The report described this as the lowest October reading since 2007.
  • Expected market time rose from 110 to 118 days, the highest since April 2020.
  • Detached homes: 105 days expected market time. Condos and townhomes: 139 days.
  • Luxury homes above $2.5 million: 952 active listings, 156 pending sales, and 183 days expected market time.
  • August closed sales: 1,755 residential resales, down 6% from August 2025. County sales-to-list ratio: 99.5%. Distressed homes, including short sales and foreclosures, were 0.3% of listings.

Southern California weekly update, October 23, 2026

Mortgage rates offered some relief but remained above 7.25%. In this separate regional weekly view, supply rose 1% and demand fell 3% over the week, pushing expected market time up five days to 149 days. The slowest market since tracking began in 2012.

Mortgage rate reference: Freddie Mac PMMS, October 22, 2026

The national average for a 30-year fixed mortgage was 7.32%, down from 7.40% the prior week. The Orange County report also noted that rates had risen from 6.75% to 7.5% over the six weeks ending in late September.

For context on purchasing power, the report’s example showed that a buyer targeting a $6,000 monthly principal-and-interest payment with 20% down could afford a $1,251,250 home at 6%, compared with $1,072,500 at 7.5%. A difference of $178,750.

🏘️ San Clemente real estate market

October status

  • Median listing price: $2,298,750
  • Median sold price: $2,112,500, up 19.0% from September’s $1,775,000
  • Active listings: 195, down 5.8% from 207
  • Median days on market: 52, down from 57
  • Sale-to-list ratio: 100%
  • Median listing price rose 14.9% from $1,999,999 in September.

San Clemente coastline and pier

San Clemente by community and ZIP

Community or area Median listing price Median days on market
Talega $1,886,950 43 days
Forster Ranch $1,939,499 37 days
Rancho San Clemente $1,089,000 38 days
Marblehead Inland $2,047,500 82 days
ZIP 92672 $2,485,750 52 days
ZIP 92673 $2,062,500 51 days

Marblehead and Rancho San Clemente

Marblehead Inland’s October snapshot shows a $2,047,500 median listing price and 82 days on market. Rancho San Clemente’s median listing price was $1,089,000, with 38 days on market. These are community-level listing indicators, not sold-price estimates. 🏡

San Clemente community search areas

Explore homes in Forster Ranch, Talega, Rancho San Clemente, Marblehead Coastal and Marblehead Inland, including Sea Summit, Pier Bowl and downtown, Southwest San Clemente, North Beach and Shorecliffs, Central San Clemente, Southeast San Clemente, and the Coast District.

Forster Ranch community monument sign in San Clemente

🔎 Search San Clemente and other South OC homes

🌊 Dana Point real estate market

October status

  • Median listing price: $2,464,900
  • Median sold price: $2,415,000, up 23.8% from September’s $1,950,000
  • Active listings: 137, down 2.1% from 140
  • Sale-to-list ratio: 98%
  • Median listing price rose 3.9% from $2,372,500 in September.

Realtor.com did not publish an October citywide median days-on-market figure for Dana Point. No citywide estimate is substituted here.

Community or area Median listing price Median days on market
ZIP 92629 $2,438,750 55 days
Capistrano Beach $2,499,750 67 days
Lantern Village $2,197,500 96 days
Dana Point Headlands $8,995,000 43 days
Niguel Shores $2,950,000 58 days

🐎 San Juan Capistrano real estate market

October status

  • Median listing price: $1,891,500, up 17.6% from September’s $1.609 million
  • Median sold price: $1,825,000, up 58.0% from September’s $1.155 million
  • Active listings: 125, down 3.1% from 129
  • Median days on market: 57, down from 58
  • Sale-to-list ratio: 99%
  • ZIP 92675 median listing price: $1,891,500
  • Marbella median listing price: $2,417,000

The sharp change in the sold median reflects a mix shift, not a value collapse. ZIP 92675 includes entry-level condos, 55+ attached homes, and gated estates. When the types of homes closing change, the median can move substantially. Marbella days on market are not included because sources conflicted.

⚖️ Buyer takeaways

Countywide, pending demand declined while expected market time increased. That can give you more time to compare homes, but prices and negotiation conditions still vary by city, property, and community. Higher mortgage rates also affect monthly payment and purchasing power.

Buyer action checklist ✅

  • Search by location, price, bedrooms, bathrooms, and property type.
  • Compare active homes with recently sold properties.
  • Review financing terms using current lender guidance.
  • Ask for details on homes that fit your criteria.
  • Consider market time and sale-to-list figures alongside price.

🔎 Start your South Orange County property search
✅ View recently sold South OC listings

🏷️ Seller takeaways

The October city snapshots show different price and market-time patterns across South OC. A useful pricing plan starts with nearby competition and recent comparable sales, then considers your home’s condition, location, layout, and features. Current financing conditions may also influence the buyers comparing your property.

A property-specific valuation can help you assess next steps before preparing, marketing, or listing your home. 📍

Landscaped pathway through a San Clemente community park

❓ October 2026 South OC real estate FAQs

What is the median home sale price in San Clemente in October 2026?

The Realtor.com October city snapshot shows a median sold price of $2,112,500.

How long does it take to sell a home in South Orange County right now?

Realtor.com reports median market time of 52 days in San Clemente and 57 days in San Juan Capistrano. It did not publish a Dana Point citywide October figure. Separately, the Orange County Housing Report showed 118 days of expected market time, while the October 23 Southern California weekly update showed 149 days for that broader region. These measures cover different areas and use different reporting methods.

What are mortgage rates in late October 2026?

Freddie Mac reported a 7.32% average for a 30-year fixed mortgage on October 22, down from 7.40% the prior week. Your actual rate and loan terms depend on your situation and lender.

Is Orange County a buyer’s or seller’s market in October 2026?

The indicators point to a selective market, rather than a simple citywide label. County expected market time increased, and pending sales declined year over year. At the same time, inventory remained below its pre-COVID average and the county sales-to-list ratio was 99.5%.

Why did San Juan Capistrano’s median sold price jump so much in one month?

The median moved with the mix of homes that sold. ZIP 92675 includes entry-level condos, 55+ attached homes, and gated estates, so different closing mixes can shift the median without indicating a broad change in underlying values.

📌 About this data

City statistics are from Realtor.com October 2026 market data. Community and ZIP figures are median listing prices and median days on market where reported; they are not sold-price measures. Citywide metrics and community-level figures should not be treated as directly interchangeable.

Countywide indicators are from the Orange County Housing Report, dated October 12, 2026. The Southern California weekly update dated October 23 is a separate regional data set. Mortgage-rate figures are from the Freddie Mac Primary Mortgage Market Survey.

For property-specific guidance, Walker Real Estate Group / Search SoCal Property is available to help you review homes, recent sales, and valuation options throughout the process. 📞

Oct. 19, 2026

Buying a San Clemente Home in 2027? 7 Things to Know (From a $1,775,000 Median Sold Price to 7.40% Rates)

Buying a San Clemente Home in 2027? 7 Things to Know (From a $1,775,000 Median Sold Price to 7.40% Rates)

San Clemente coastal home with an ocean view in warm natural daylight

Yes, buying in San Clemente in 2027 starts with knowing the current numbers: a $1,775,000 median sold price, 57 median days on market and a 98% sale-to-list ratio. The seven points below turn that market context into a practical plan for your search.

TL;DR: 7 things to know

  • 🏖️ Review the citywide sold and listing figures.
  • 🏘️ Choose between attached and detached homes.
  • 🗺️ Focus your search on communities that fit your priorities.
  • 💳 Plan around the current mortgage rate.
  • ⏱️ Use market timing and county context wisely.
  • 📋 Review property, HOA and coastal details before offering.
  • 🤝 Get local guidance from search through closing.

🏖️ 1. Know what the market actually costs right now

San Clemente’s September 2026 figures offer a useful starting point for setting your budget and expectations. Realtor.com Economic Research reports a $1,775,000 median sold price, a $1,999,999 median listing price, 207 active listings, 57 median days on market, and a 98% sale-to-list ratio.

The median sold price reflects completed sales; the median listing price reflects homes being offered for sale. They describe different parts of the market, so use each for context rather than treating either as the price of a specific home.

A 98% sale-to-list ratio means sales were close to asking prices in the source’s measure. It is a useful reference, not a rule for setting your offer. The right price depends on the home, its condition, comparable sales and current competition.

Quick answer: Use the sold price, listing price, inventory and sale-to-list ratio together to frame your search, not as a price estimate for an individual home.

Palm-lined San Clemente beach-town streetscape in bright natural daylight

🏘️ 2. Decide condo or townhome versus single-family first

Your preferred property type can shape your budget, search area and home-maintenance expectations. From January through July 2026, the detached-home median was $2,000,000 across 157 closed sales; the attached-home median was $1,150,000 across 116 closed sales. The roughly $850,000 gap reflects different priorities, not a better or worse choice.

For attached homes, the CRMLS snapshot as of October 5, 2026 showed 31 active listings, prices from $629,000 to $4,300,000, a median of $922 per square foot, and 87 median days on market. The broad price range reflects variety in location, size, condition and features.

If you’re considering a condo or townhome, include association documents in your review. HOA dues vary by community; confirm the current dues and what they cover for each property.

San Clemente attached condo and townhome community exterior

Quick answer: Choose the property type that fits your budget and ownership preferences, then compare homes within that category.

🗺️ 3. Pick your neighborhood before your house

Start with the San Clemente community that fits your preferred setting and day-to-day needs, then compare homes within it. These local areas offer different surroundings and housing options:

  • Forster Ranch: An established residential area with a range of home styles.
  • Talega: A planned community with varied residential options and shared amenities.
  • Rancho San Clemente: An inland community with a mix of housing types.
  • Marblehead and Sea Summit: Communities with distinct settings and home options.
  • Pier Bowl and downtown: A coastal town-center area near the pier, beach and Avenida Del Mar.
  • North Beach and Shorecliffs: Coastal areas with varied neighborhood settings.

Descriptions are broad; the feel and features can differ by street and property. As you narrow your options, consider your preferred location, property style, access needs and community features.

Search San Clemente homes for sale and browse available listings by community.

San Clemente hillside neighborhood with coastal backdrop at dusk and warm interior lights

Quick answer: Choose a few communities that fit your priorities, then compare individual homes and streets within those areas.

💳 4. Budget for today’s rate, not last year’s

For planning, use the current verified rate as a reference and ask a lender to review your finances before you begin serious touring. Freddie Mac’s Primary Mortgage Market Survey reported a 30-year fixed rate of 7.40% for the week ending October 8, 2026.

Rates can change, so this figure is context for your 2027 planning, not a prediction of the rate you will receive. Ask your lender how current rates affect your price range and budget. A lender pre-review before offer season can help you understand your financing options without relying on payment estimates that may not fit your situation.

Quick answer: Ask a lender to review your budget using current rate conditions before you tour or make an offer.

⏱️ 5. Understand the timeline

San Clemente’s September median days on market was 57 citywide and 87 for attached homes in the October 5 CRMLS snapshot. These are different market measures and time periods, but both can help you set expectations for how long listings may remain available.

For county context, the OC Market Brief dated September 28, 2026 reported 4,952 active listings, 1,349 pending sales, a 110-day expected market time, a balanced market, a 99.5% sales-to-list ratio, a $1.30M median list price, and county values up 2.8% year over year. Countywide figures are context for San Clemente, not a substitute for city-level data.

This context can help you prepare for negotiation while staying ready to act when a suitable home comes up. A home’s condition, location and demand still matter.

Quick answer: Use days on market and county reports as context; assess each home and offer on its own merits.

📋 6. Get your due-diligence checklist right

Before you offer, gather the documents and inspections needed to understand the property. A practical review includes:

  • Inspections: Arrange appropriate inspections and follow up on items that need more review.
  • HOA documents: For attached homes or properties in an association, review dues, reserves, insurance, rental rules and the association’s governing documents. Dues vary by community.
  • Permit history: Review available permit records for completed work and additions.
  • Coastal considerations: Consider the home’s proximity to the ocean and any maintenance needs associated with its setting.
  • Comparable sales: Review nearby sold properties to understand how similar homes have performed. Browse recently sold listings.

Give yourself time to review the information and raise questions before moving forward. Your agent can help coordinate the process and identify documents to discuss with the appropriate professionals.

Quick answer: Review the home, its records, association documents and recent comparable sales before you finalize an offer.

🤝 7. Work with a local agent who knows San Clemente street by street

Local guidance helps you compare homes beyond the headline price. A neighborhood, property type, condition and recent comparable sales can all affect how a home fits your plans and how you approach an offer.

With personalized support, you can narrow your search, review available information and keep track of each step from your first search through closing. Walker Real Estate Group is available 24/7 to assist throughout the process.

Quick answer: Work with an agent who can help you compare local options and stay supported through closing.

✅ Your buyer action plan

  1. Get pre-approved with today’s rate conditions in mind.
  2. Choose your property type.
  3. Select 2–3 communities that fit your priorities.
  4. Tour homes with recent sold comparisons in hand.
  5. Prepare your offer with a local agent.

🔎 Start your San Clemente home search

Ready to take the next step? Explore current listings, review recent sales or request a free home valuation.

Our team is available around the clock to help you move forward with clear information and support from search through closing. Connect with Walker Real Estate Group.

📊 About this data

Citywide September 2026 figures are from Realtor.com Economic Research. Property-type figures are from CRMLS for January–July 2026; the attached-market snapshot is from CRMLS as of October 5, 2026. The mortgage rate is from Freddie Mac’s Primary Mortgage Market Survey for the week ending October 8, 2026. County context is attributed separately to the OC Market Brief dated September 28, 2026, and the Sold in South OC September report / OC Housing Report dated September 14, 2026.

These figures provide market context and are not a valuation of any individual property.

SEO details

  • Slug: san-clemente-buying-a-home-2027
  • Meta description: Buying a San Clemente home in 2027? 7 things to know: a $1,775,000 median sold price, 57 median days on market, rates and neighborhood tips from a local agent.
  • Meta keywords: san clemente real estate, san clemente homes for sale, san clemente real estate agent, san clemente condos for sale, south orange county real estate, orange county real estate market, buy a house in san clemente, san clemente neighborhoods, sell house orange county

This post is sectioned so it can be pasted one section at a time through the Real Geeks editor’s source view.

Published for the Walker Real Estate Group, serving San Clemente, Dana Point, San Juan Capistrano and South Orange County.

Oct. 12, 2026

San Juan Capistrano Real Estate in 2026: Historic Charm, Equestrian Trails & a $1,609,000 Median List Price

San Juan Capistrano Real Estate in 2026: Historic Charm, Equestrian Trails & a $1,609,000 Median List Price

Spanish Colonial-style San Juan Capistrano home with landscaped grounds and surrounding hills

URL slug: san-juan-capistrano-historic-equestrian-2026
Meta description: San Juan Capistrano real estate in 2026: a $1,609,000 median list price, historic Los Rios, equestrian trails and neighborhoods, plus buyer and seller takeaways.
Meta keywords: san juan capistrano real estate, san juan capistrano homes for sale, san juan capistrano real estate agent, san juan capistrano condos for sale, san juan capistrano equestrian homes, los rios historic district, orange county real estate market, south orange county real estate, sell house orange county

San Juan Capistrano’s September 2026 median listing price was $1,609,000, with a median sold price of $1,155,000. The city pairs historic Los Rios and Mission-area homes with equestrian properties, gated estates, townhomes and other established communities, so your search or pricing plan should reflect the specific property type and neighborhood. 🏡

San Juan Capistrano Market Snapshot: September 2026 📊

Citywide indicator September 2026
Median listing price $1,609,000; +9.59% year over year, +24.27% month over month
Median sold price $1,155,000; -12.96% year over year, -17.50% month over month
Price per square foot $738; +1.29% year over year
Active listings 129; -0.69% year over year
Median days on market 58 days; -8.66% year over year
Sale-to-list ratio 98%
Median rent $5,650/month

The difference between the median listing and sold prices reflects the mix of homes closing across ZIP code 92675: condos, 55+ attached homes, townhomes and smaller residences alongside gated custom estates. It is not, by itself, a one-direction value story. Compare similar properties and recent sales before you decide what a home is worth. 📍

ZIP code 92675 and Marbella

Area Median listing price Listing price per sq. ft. Active listings Median days on market Median rent
ZIP code 92675 $1,609,000 $735 - 57 days $5,650/month
Marbella $2,417,000 $713 5 67 days -

Marbella’s neighborhood figures reflect a small number of active listings, so a single property can move the median. Use these numbers as market context, not as a price estimate for a particular home. 📈

Orange County and mortgage-rate context

The OC Market Brief, report dated September 28, 2026, reported 4,952 active listings, 1,349 pending sales and expected market time of 110 days, described as a balanced market. The countywide sales-to-list ratio was 99.5%, the median list price was $1.30M, and Orange County home values were +2.8% year over year.

Freddie Mac’s Primary Mortgage Market Survey for the week ending October 8, 2026, reported a 30-year fixed mortgage rate of 7.40%, up from 7.28% the prior week. A higher rate can affect what fits your monthly budget. Ask a lender to review your financing before making an offer; payment costs depend on your financing and property, so no property-specific estimate is provided here. 💳

Communities by Lifestyle and Property Type 🧭

Tier 1: Historic core and downtown character

Los Rios Historic District: Historic adobe-era and board-and-batten homes near Mission San Juan Capistrano and the downtown train depot. The neighborhood’s roots are tied to the Mission’s 1776 founding. Homes are rarely listed and may be subject to preservation policies and the Los Rios Specific Plan. Check the City’s historic preservation information for address-specific status and permitted changes.
Best fit: You value historic character and a central setting, and are prepared to review preservation requirements.

Mission-area and Del Obispo-area established homes: Older single-family homes with varied ages, lot sizes and renovation levels, near the Mission, downtown dining and shops.
Best fit: You want an established neighborhood and a central location, with home condition and updates considered property by property.

Historic-home checklist: Review preservation or historic overlay restrictions, Inventory of Historic and Cultural Landmarks status, permitting history, renovation scope, structural and systems condition, and possible Mills Act eligibility. The City participates in California’s Mills Act program, which can reduce property taxes for qualifying historic buildings. Eligibility requires listing on the City’s Inventory of Historic and Cultural Landmarks and a minimum 10-year City contract with maintenance requirements and the Secretary of the Interior’s Standards for the Treatment of Historic Properties. Review the City’s Mills Act guide and confirm eligibility with the City; a tax reduction is not guaranteed. 🏛️

Historic Mission-area adobe-era and board-and-batten streetscape in San Juan Capistrano

Tier 2: Equestrian and large-lot living 🐎

San Juan Capistrano is an equestrian city in coastal Orange County, with zoning that permits horse keeping and a maintained network of unpaved hiking, biking and equestrian trails that connects with open space and regional wilderness. The City’s Public Works Department maintains the public trails, and the City publishes a trail map and equestrian, trail and open space information. 🐎

  • The Hunt Club: Guard-gated equestrian estate community with large custom parcels, established equestrian infrastructure and trail access. Best fit: You need estate space and horse facilities.
  • Mission Hills Ranch: Gated, equestrian-oriented community with larger homes and estate parcels that may have equestrian improvements. Best fit: You want a larger property in a gated setting.
  • Rancho Madrina: One-to-two-acre lots with equestrian easements and newer construction. Best fit: You are comparing newer homes with larger parcels.
  • San Juan Hills Estates: Acre-plus lots, existing barn infrastructure and canyon or ocean views. Best fit: You are seeking land and existing equestrian features.
  • Sun Ranch and Los Corrales: Larger-lot, semi-rural settings with usable land and potential equestrian improvements. Best fit: You prioritize open space and flexibility.
  • Peppertree Bend: Hillside enclave of roughly 44 custom estates, typically on one-acre-plus lots, with panoramic views. Best fit: You want a private custom-home setting.
  • Hidden Mountain and Capistrano Royale: Gated hillside and established residential communities. Best fit: You are comparing gated settings and home styles.

Equestrian due diligence: Confirm parcel-level zoning, such as RA or RSE-40,000, with the City; recorded trail easements; HOA CC&Rs; stable and barn condition; trailer access and turning areas; usable flat areas; arenas and turnouts; fencing and gates; drainage and grading; water and utility capacity; permits for existing structures; and fire hazard considerations. Zoning alone does not guarantee horse-keeping rights. ✅

San Juan Capistrano equestrian property with stable, arena, horses and landscaped grounds

Tier 3: Gated and luxury communities

Marbella is a guard-gated golf and country club community with custom and luxury single-family homes. Its September listing figures appear in the table above. Hidden Mountain, Capistrano Royale and Peppertree Bend also offer gated or hillside residential settings, with property characteristics that vary by location.
Best fit: You are seeking privacy, custom homes or a specific gated-community setting.

Tier 4: Family, coastal-adjacent and value-oriented

  • San Juan Hills: Established area with Mesa Vista, Loma Vista, and San Juan Hills East and West. Housing includes single-family homes, townhomes and condominiums. Best fit: You want to compare multiple housing types within established neighborhoods.
  • Village San Juan: Established townhome and attached-home community. Best fit: You prefer lower-maintenance living.
  • Belle Cliff at Pacifica San Juan: Newer construction and modern floor plans. Best fit: You are looking for a newer-home option.
  • Established Del Obispo-area neighborhoods: Older single-family homes with varied lots, condition and renovation levels. Best fit: You want an established central location.

Buyer Takeaways: Start with the Right Comparisons 🔎

San Juan Capistrano condos for sale: Condos and townhomes can provide a different entry point from detached homes and custom estates. Review the association documents, reserves, insurance and rental rules as part of your purchase review.

Buyer checklist

  • Confirm your financing with a lender at current rates.
  • Compare homes by community and property type, not just the citywide median.
  • Review HOA documents and CC&Rs.
  • Confirm zoning and easements for equestrian properties.
  • Review preservation rules for historic properties.
  • Compare recent sold data with current listings.

Search San Juan Capistrano homes for sale to explore available properties. 🏠

Seller Takeaways: Price for Your Property Type 📋

A median of 58 days on market and a 98% sale-to-list ratio make accurate pricing and preparation important. Historic homes, equestrian properties and gated estates each need comparable sales suited to their features, not just the citywide median.

Seller checklist

  • Request a San Juan Capistrano home valuation.
  • Review recently sold listings.
  • Compare your home with active competition.
  • Complete priority repairs.
  • Prepare permits and HOA or association documents.
  • Price against current market evidence.
  • Review offers with a San Juan Capistrano real estate agent.

Upscale gated San Juan Capistrano estate exterior with warm dusk lighting

About This Data 📌

City, ZIP and neighborhood figures are from Realtor.com Economic Research, September 2026. Countywide figures are from the OC Market Brief, September 28, 2026. The mortgage rate is from Freddie Mac’s Primary Mortgage Market Survey, week ending October 8, 2026. These figures provide market context, not a valuation of any individual property. Neighborhood figures reflect a small number of active listings.

Walker Real Estate Group is available 24/7 to support you from your first search or valuation request through closing. You can reach out for help comparing properties, preparing to sell or planning your next step. 🤝

Real Geeks editor note: This post is sectioned so it can be pasted one section at a time through the post editor’s source view.

Oct. 5, 2026

San Clemente Real Estate 2026: Condo vs. Single-Family Home Prices Compared

San Clemente Condos vs Single-Family Homes in 2026: Prices, Costs & How to Choose

San Clemente coastline and residential communities along the Pacific Ocean

📋 San Clemente Condo vs. Single-Family Snapshot

  • Report date: October 5, 2026
  • Coverage: San Clemente, California
  • Prepared by: Walker Real Estate Group / Search SoCal Property
  • URL slug: san-clemente-condos-vs-single-family-homes-2026
  • Meta description: Compare San Clemente condos and townhomes with single-family homes in 2026, prices, price per square foot, HOA considerations, and buyer and seller takeaways.
  • Meta keywords: San Clemente real estate, San Clemente condos for sale, San Clemente homes for sale, San Clemente real estate agent, San Clemente condo vs single family home, South Orange County homes for sale, South Orange County real estate, Orange County real estate market, San Clemente condos, san clemente real estate 2026.

San Clemente offers two distinct ownership paths in 2026: attached homes, including condos and townhomes, and detached single-family homes. The right choice depends on your purchase budget, monthly ownership costs, maintenance preferences, outdoor-space needs, financing, and long-term plans. 🏡

📊 Citywide San Clemente Market Snapshot

Realtor.com Economic Research reported the following San Clemente market conditions for September 2026:

Market indicator September 2026
Median sold price $1,775,000
Median listing price $1,999,999
Median price per square foot $821
Active listings 207
Median days on market 57 days
Sale-to-list ratio 98%

The median sold price increased 3.50% month over month and 11.04% year over year. The median listing price was unchanged month over month and declined 8.88% year over year. Homes sold about 2.25% below asking on average.

A separate Redfin three-month market window through July 2026 placed the citywide median sale price at approximately $1,849,074, up 3.0% year over year. This is a Redfin three-month median that blends property types and uses a different reporting window from the CRMLS and Realtor.com figures.

🏠 The Two San Clemente Price Stories

Detached single-family homes

CRMLS-based data for January through July 2026 show:

  • Median sale price: $2,000,000
  • Closed sales: 157
  • Average sale price: $2,284,885

The detached median increased from $1.9 million in 2025 to $2.0 million in 2026, an increase of about 5.3%. At the same time, detached closed sales declined from 179 to 157 over the comparison period.

Attached homes: condos and townhomes

For the same January-through-July 2026 period:

  • Median sale price: $1,150,000
  • Closed sales: 116

The difference between the $2,000,000 detached median and the $1,150,000 attached median is the central pricing story. A single citywide average or median can hide this split because San Clemente includes beach-close condos, townhomes, established single-family neighborhoods, newer planned communities, hillside homes, and luxury coastal properties.

Your comparison should begin with the correct property type. A citywide median is a starting point, not a direct valuation for a specific condo, townhome, or detached home.

🏢 San Clemente Attached Market Detail

A live CRMLS report retrieved October 5, 2026, reviewed current condo and townhome listings:

  • Active attached listings: 31
  • Average list price: $1,381,312
  • Active list-price range: $629,000 to $4,300,000
  • Average price per square foot: $922
  • Average days on market: 87 days

The same live report reviewed 78 recent attached sale records:

  • Average list price: $1,339,943
  • Average sale price: $1,320,858
  • Average price per square foot: $857
  • Average days on market: 36 days

These attached listings represent a broad range of homes. Coastal and hillside enclaves may include different layouts, views, parking arrangements, and association services. Attached-home examples in San Clemente market coverage include Vista Pacifica, Faire Harbour, Vilamoura, and Santalana, along with attached options within the Talega master plan.

🏢 Search San Clemente condos for sale

⚖️ Cost and Ownership Comparison

Purchase price

Attached homes generally provide a lower purchase-price entry point than detached homes in the current San Clemente data. That may help you preserve cash for reserves, improvements, or other goals.

Detached homes generally require a higher purchase price but may provide more control over the lot, exterior, and future improvements.

HOA dues and reserves

HOA dues are community-specific and are not tracked as a citywide median. Before buying, confirm:

  • Current dues
  • What the dues cover
  • Reserve funding
  • Insurance responsibilities
  • Rules and restrictions
  • Pending or planned assessments
  • Maintenance responsibilities

Some San Clemente neighborhoods have attached homes with association dues, while many established single-family areas do not. Some master-planned single-family communities also have association services and amenities.

Maintenance

A condo or townhome association may manage some exterior elements, common areas, landscaping, or amenities. Your responsibility may still include the interior, systems, appliances, and other items defined in the governing documents.

With a detached home, you generally have more direct responsibility for the roof, exterior, landscaping, drainage, and other property components. Review the specific ownership structure before making an offer.

Outdoor space

Detached homes usually offer more private outdoor space and greater flexibility for yards, patios, gardens, or other improvements.

Attached homes may provide a private patio, balcony, or shared outdoor amenities. The available space and permitted uses vary by community.

Parking

Compare garage spaces, assigned parking, guest parking, street parking, storage, and visitor restrictions. Parking can be especially important in coastal and downtown-adjacent areas.

Insurance

Review both your individual insurance requirements and the association’s master policy. Confirm what is covered by the HOA and what remains your responsibility.

Financing and condo approval

Condo financing may require additional review of the association and project. Lenders can request condo questionnaires and documents covering budgets, reserves, insurance, litigation, repairs, and other project details.

Project warrantability can affect available financing. Ask your lender to review the association early in the process so you understand any documentation or approval requirements before writing an offer. 💼

Rental and investment considerations

If you are purchasing an investment property, review rental restrictions, lease terms, minimum rental periods, occupancy rules, and association policies. A lower purchase price does not remove the need to evaluate ongoing costs, property condition, financing, insurance, and resale factors.

🧭 San Clemente Neighborhood and Community Breakdown

The following neighborhoods and communities provide a comprehensive search framework for San Clemente. Property types vary within each area, so use the address and current listing details as the final reference.

ZIP codes are useful for search filters, not for ranking quality. San Clemente's 92672 showed a $2,199,000 median listing price and 60 median days on market in September 2026, and 92673 showed $1,974,500 and 50 days. Housing stock, lot sizes, ages, views, and association structures vary widely inside both ZIP codes.

Forster Ranch

Forster Ranch generally skews toward detached single-family housing, including established hillside and family-oriented communities. Attached opportunities may appear, but inventory often centers on detached homes. The September 2026 median listing price was $1,864,499, with 37 median days on market.

Forster Ranch community entrance in San Clemente

Talega

Talega is a master-planned community with detached homes, townhomes, and other attached options. Its resort pools, trails, and golf-course infrastructure create a planned-community ownership model. The September 2026 median listing price was $2,024,500, with 56 median days on market.

Rancho San Clemente

Rancho San Clemente includes hillside housing with both attached and detached options. Attached homes are an important part of the local search, while detached properties may offer more privacy, outdoor space, or elevated positioning. The September 2026 median listing price was $1,099,499, with 30 median days on market.

Marblehead Coastal and Marblehead Inland, including Sea Summit

Marblehead includes coastal and inland settings, with a mix of detached homes, attached communities, newer construction, and view-oriented properties. Sea Summit is included within this broader search area. Marblehead Inland recorded a September 2026 median listing price of $2,112,499 and 64 median days on market.

Pier Bowl and downtown

The Pier Bowl and downtown area can provide more attached housing options, including condos and townhomes, along with selected cottages and detached properties. Parking, walkability, HOA documents, and proximity to the Pier are important comparison points.

Southwest San Clemente

Southwest San Clemente generally emphasizes coastal detached homes, cottages, custom properties, and select attached housing. Exact value depends on beach access, views, parking, condition, and lot position.

North Beach and Shorecliffs

North Beach and Shorecliffs include a mix of attached and detached housing. Buyers should compare parking, coastal access, community rules, views, and the responsibilities associated with each ownership structure.

Central San Clemente

Central San Clemente includes established detached homes, smaller attached properties, and varied housing near downtown. Property age, parking, lot size, and walkability can create significant differences between listings.

Southeast San Clemente

Southeast San Clemente generally includes more detached housing, including established and hillside properties, while attached options may be available in selected communities.

Coast District

The Coast District includes a range of housing types, with detached homes and attached communities represented in different sections. Review each property’s exact neighborhood, HOA structure, parking, and location.

For additional local context, review the San Clemente real estate 2026 city guide and the San Clemente neighborhoods guide. 🗺️

✅ Buyer Takeaways and Action Checklist

A condo or townhome may fit your plans if you prioritize:

  • Lower purchase-price entry
  • Less direct exterior maintenance
  • Community amenities
  • A second home or lock-and-leave setup
  • Coastal or downtown access

A single-family home may fit your plans if you prioritize:

  • Private outdoor space
  • More control over improvements
  • Larger living areas
  • Greater separation from shared walls
  • A traditional family-home layout

Buyer checklist

  • Set your maximum purchase price and monthly budget.
  • Compare mortgage costs at the Freddie Mac September 24, 2026 30-year fixed average of 7.03%.
  • Review active and recently sold properties by property type.
  • Confirm HOA dues, reserves, insurance, rules, and assessments.
  • Ask your lender about condo questionnaires and project warrantability.
  • Compare parking, outdoor space, maintenance, and rental policies.
  • Review the property’s neighborhood and exact location.
  • Complete inspections and document review before closing.

🔎 Start your San Clemente property search

🏷️ Seller Takeaways and Pricing Plan

For condo and townhome owners

Your pricing plan should focus on comparable attached sales, not the citywide detached median. Review:

  • Same community or competing communities
  • Floor level and orientation
  • Views and outdoor space
  • Parking and storage
  • Interior condition
  • HOA dues and included services
  • Association reserves and assessments
  • Recent attached sale prices and market time

Present HOA documents and property information in an organized format. Buyers and lenders may need association details early in the transaction.

For single-family owners

Detached sellers should compare homes by:

  • Lot size and usability
  • Living area and floor plan
  • View and elevation
  • Renovations and condition
  • Garage and parking
  • Outdoor improvements
  • Neighborhood and school-search context
  • Recent detached closed sales

The detached median sale price was $2,000,000 across 157 closed sales from January through July 2026. Your home still requires a property-level analysis based on location, condition, features, and current competition.

📍 Request a San Clemente property valuation

✅ View recently sold South OC listings

📞 Ongoing San Clemente Real Estate Support

Walker Real Estate Group / Search SoCal Property can help you compare San Clemente condos, townhomes, and single-family homes, review recent sales, evaluate HOA information, prepare an offer, or plan a listing. You can receive personalized assistance throughout the process, from your first search or valuation request through negotiations, escrow, and closing.

Support is available 24/7 when you are ready to review your options. 🤝

Sept. 28, 2026

Sold in South OC: September 2026 Real Estate Sales Report for San Clemente, Dana Point & San Juan Capistrano

Sold in South OC: September 2026 Real Estate Sales Report for San Clemente, Dana Point & San Juan Capistrano

Aerial view of the San Clemente Pier and South Orange County coastline at sunset

📅 Report period: September 2026
📍 Coverage: San Clemente, Dana Point, and San Juan Capistrano
🏢 Prepared by: Walker Real Estate Group / Search SoCal Property
🔗 URL slug: sold-in-south-oc-september-2026
📝 Meta description: Review September 2026 South OC real estate market data for San Clemente, Dana Point, and San Juan Capistrano, including inventory, market time, pricing references, and buyer and seller takeaways.
🔑 Meta keywords: South OC real estate, September 2026 real estate sales report, San Clemente real estate market, Dana Point real estate market, San Juan Capistrano real estate, Orange County housing market, recently sold homes South Orange County, San Clemente home valuation, Dana Point home valuation, San Juan Capistrano home valuation

📊 September 2026 South OC market snapshot

September data shows a selective South Orange County real estate market with elevated mortgage rates, measurable inventory, and continued demand for well-positioned homes.

All city figures in this report come from Realtor.com Economic Research market data for September 2026, so every number below is directly comparable across the three cities.

Countywide indicators

Orange County Housing Report, dated September 14, 2026

  • 4,939 active listings
  • 1,468 pending sales over the prior 30 days
  • 101 days of expected market time
  • Active inventory declined by 43 listings over two weeks
  • Pending demand declined by 60 sales, or 4%

Socal Journal: week of September 7, 2026

  • 4,984 active residential listings
  • 609 new listings
  • 443 closed transactions during the prior week
  • 41-day median market time
  • Approximately 61-day average market time
  • 30-year mortgage rates near 6.85% as of September 10

These reports should not be combined as one data set. The Orange County Housing Report uses its own inventory, pending, and expected-market-time calculations. The Socal Journal report covers a weekly residential listing and transaction view.

Freddie Mac PMMS, September 24, 2026

  • 30-year fixed average: 7.03%
  • Prior week: 6.95%
  • One year earlier: 6.30%

OC Market Brief, report date September 14

  • Sales-to-list ratio: 99.5%
  • Median active list price: $1.30 million

The OC Market Brief uses a separate countywide methodology and should be reviewed independently from the other reports. 📈

San Clemente coastline and pier under a bright blue sky

🏘️ San Clemente real estate market

September status

  • Median sold price: $1,775,000 (+3.50% month over month, +11.04% year over year)
  • Median listing price: $1,999,999 (0% month over month, -8.88% year over year)
  • Median price per square foot: $821 (+2.13% month over month, -1.96% year over year)
  • Active listings: 207 (-3.91% month over month, -16.92% year over year)
  • Median days on market: 57 days (+9% month over month, -0.91% year over year)
  • Sale-to-list ratio: 98% (homes sold about 2.25% below asking on average)

San Clemente by community

Community Median listing price Median days on market
Talega $2,024,500 56 days
Forster Ranch $1,864,499 37 days
Marblehead Inland $2,112,499 64 days
Rancho San Clemente $1,099,499 30 days

ZIP 92672 shows a $2,199,000 median listing price and 60 median days on market, while ZIP 92673 shows $1,974,500 and 50 days.

Most recent available references

Pacific Sotheby’s Q2 2026 citywide data

  • Median sales price: approximately $2.02 million
  • Average days on market: 37 days
  • Closed sales: 170
  • Active listings: 105

Redfin three-month window ending June 2026

  • Median sale price: approximately $1.97 million
  • Approximately 33 days on market
  • 199 homes sold in June

These historical reference points use different timeframes and methodologies than the September 2026 Realtor.com snapshot above.

San Clemente community search areas

Our published San Clemente neighborhood guide covers the following San Clemente neighborhoods and communities:

  • Forster Ranch
  • Talega
  • Rancho San Clemente
  • Marblehead Coastal and Marblehead Inland, including Sea Summit
  • Pier Bowl and downtown
  • Southwest San Clemente
  • North Beach and Shorecliffs
  • Central San Clemente
  • Southeast San Clemente
  • Coast District

Use the live sold search to filter by community, property type, price range, bedrooms, bathrooms, and closing period. 🔎

Forster Ranch community monument sign in San Clemente

🌊 Dana Point real estate market

September status

  • Median sold price: $1,950,000 (+9.24% month over month, +19.63% year over year)
  • Median listing price: $2,372,500 (+3.86% month over month, +13.07% year over year)
  • Median price per square foot: $1,171 (+0.62% month over month, +6.66% year over year)
  • Active listings: 140 (-3.01% month over month, -14.81% year over year)
  • Median days on market: 49 days (+16.13% month over month, -1.82% year over year)
  • Sale-to-list ratio: 100%

Dana Point by community

Community Median listing price Median days on market
Capistrano Beach $2,449,500 59 days
Lantern Village $2,200,000 71 days
Dana Point Headlands $8,995,000 58 days
Niguel Shores $3,349,000 36 days

ZIP 92629 shows a $2,395,000 median listing price and 49 median days on market.

Most recent available references

Pacific Sotheby’s Q2 2026 citywide data

  • Median sales price: approximately $2.03 million
  • Average days on market: 60 days
  • Closed sales: 101
  • Active listings: 87

This Q2 reference provides historical context, while the September 2026 Realtor.com snapshot above is the current city comparison point.

🐎 San Juan Capistrano real estate market

September status

Realtor.com’s September 2026 citywide snapshot provides the most recent available reference for San Juan Capistrano:

  • Median listing price: $1.609 million
  • Median sold price: $1.155 million
  • Active listings: 129
  • Median days on market: 58 days
  • Sale-to-list ratio: approximately 98%
  • Median listing price year-over-year: up 9.59%
  • Active listings year-over-year: down 0.69%
  • Days on market year-over-year: down 8.66%

Marbella shows a $2,417,000 median listing price and 67 median days on market.

The citywide sold median moved down while the listing median moved up because ZIP 92675 blends entry-level condos, 55+ attached homes, and gated estates, so the mix of what closed shifts the median. This is a mix shift, not a value collapse.

Pacific Sotheby’s Q2 2026 reference

  • Median sales price: approximately $1.85 million
  • Average days on market: 34 days
  • Closed sales: 87
  • Active properties: 70

The Realtor.com and Pacific Sotheby’s figures differ because they use different reporting dates, data sets, and market definitions. The Realtor.com snapshot is closer to the September reporting period, while the Pacific Sotheby’s figures provide a Q2 comparison point.

⚖️ Buyer takeaways

More information supports better decisions

  • Countywide active inventory remained near 4,900 listings in the September reports.
  • The Socal Journal reported 443 closed transactions during the prior week and 609 new listings.
  • Market time varied considerably by source, from a 41-day median to an approximately 61-day average.
  • Mortgage rates reached 7.03% in the Freddie Mac September 24 release.

For buyers, monthly payment planning remains important. Compare current homes by total price, property type, condition, location, and likely ownership costs, not by list price alone.

Buyer action checklist

  • Search current South OC listings by price, bedrooms, bathrooms, and property type.
  • Review recently sold homes before making an offer.
  • Compare active listings with similar closed sales.
  • Confirm financing terms at current interest rates.
  • Request property details for homes that match your criteria.

🔎 Start your South Orange County property search

🏷️ Seller takeaways

Pricing and presentation remain important

The countywide OC Market Brief reported a 99.5% sales-to-list ratio, while city references show continued demand in San Clemente, Dana Point, and San Juan Capistrano. At the same time, available inventory and market-time measures indicate that buyers have more information and more opportunities to compare homes.

A seller’s pricing plan should account for:

  • Current competing listings
  • Recently closed properties
  • Property condition and improvements
  • Location and community
  • Lot, view, floor plan, and amenities
  • Current buyer financing conditions
  • Expected market time

A current home valuation can help establish a practical price range before repairs, preparation, marketing, or listing decisions begin. 🏡

📍 Request a San Clemente property valuation
📍 Request a Dana Point property valuation
📍 Request a San Juan Capistrano property valuation

✅ View recently sold South OC listings

Landscaped pathway through a San Clemente community park

📌 About this data

All market figures in this report come from Realtor.com Economic Research September 2026 data. Realtor.com metrics reflect MLS-listed homes and may differ from brokerage or MLS exports because of different filters, geography, property-type selections, and reporting periods. Buyers and sellers should confirm current numbers for a specific property before making a decision.

Walker Real Estate Group is available 24/7 to help you search current properties, review recent sales, request a free valuation, and plan your next South Orange County real estate step. 📞

Sept. 21, 2026

San Juan Capistrano Communities in 2026: A Neighborhood-by-Neighborhood Guide to Gated, Equestrian, Historic & Family Living

San Juan Capistrano Communities in 2026: A Neighborhood-by-Neighborhood Guide to Gated, Equestrian, Historic & Family Living

Spanish Colonial-style San Juan Capistrano home with landscaped grounds and surrounding hills

URL slug: san-juan-capistrano-neighborhoods-2026
Meta keywords: San Juan Capistrano neighborhoods 2026, San Juan Capistrano communities, San Juan Capistrano homes for sale, Marbella San Juan Capistrano, Hunt Club San Juan Capistrano, Los Rios Historic District, San Juan Capistrano equestrian homes, San Juan Hills, Village San Juan, San Juan Capistrano real estate

San Juan Capistrano is not one single housing market. It is four markets in one city: historic adobe-era and Mission-area homes, gated custom estates, equestrian and large-lot properties, and family-oriented townhomes and newer construction. 🏡

Because the citywide 92675 median blends these different property types, each community requires its own comparable sales, property review, and pricing analysis.

San Juan Capistrano Market Snapshot: September 2026 📊

Market indicator September 2026 data
Median listing price Approximately $2,199,900
Median sale price Approximately $1,857,500
Active listings Approximately 132
Median days on market Approximately 51 days
Sale-to-list ratio Approximately 100%
Price per square foot Approximately $749
Single-family median list price Approximately $2,537,500
Active single-family inventory Approximately 54 homes
Single-family median DOM Approximately 56 days
Altos Market Action Index Approximately 40: slight seller’s advantage
Listings with price decreases Approximately 41%

Additional Q2 2026 reporting from Pacific Sotheby’s International Realty showed a median sale price near $1.85 million, average days on market of approximately 34 days, 87 closed sales, and inventory near 70 homes. Redfin reported a median sale price near $1.8 million, approximately 34–44 days on market, and a 99.3% sale-to-list ratio.

These figures are not identical because MLS reports, brokerage summaries, Altos Research, Redfin, and Realtor.com use different property filters, reporting periods, and methodologies. Review the Realtor.com San Juan Capistrano market report and Redfin market data for current updates. Verify current figures before pricing a property or making an offer. 📈

Tier 1: Historic Core and Downtown Character 🕊️

Los Rios Historic District

  • Setting: Historic residential district near Mission San Juan Capistrano and the downtown train depot
  • Property profile: Older cottages, adobe-related structures, traditional homes, and smaller or irregular lots
  • Lifestyle focus: Walkability, historic character, mature landscaping, restaurants, shops, and cultural destinations
  • Best fit: Buyers who value location, preservation, architectural character, and a more walkable daily routine

The City of San Juan Capistrano identifies Los Rios as a historic resource area governed by preservation policies and the Los Rios Specific Plan. Review the city’s historic resources information and Los Rios Specific Plan.

Verify me: Individual property status, preservation restrictions, permitted uses, lot dimensions, and renovation requirements must be confirmed for each address.

Mission Flats and Mission-Area Homes

  • Setting: Residential streets surrounding Mission San Juan Capistrano and the historic downtown core
  • Property profile: Established single-family homes, traditional architecture, and remodeled residences
  • Lifestyle focus: Access to the Mission, downtown dining, local events, and central transportation
  • Best fit: Buyers seeking a central location with older-home character and convenient access to town

Learn more about the area’s cultural setting through Mission San Juan Capistrano. Verify me: “Mission Flats” may be used differently in local guides and MLS descriptions. Confirm the exact neighborhood designation and applicable restrictions by address.

Del Obispo-Area Established Homes

  • Setting: Established residential area near Del Obispo Street and central San Juan Capistrano
  • Property profile: Detached homes with varied ages, layouts, lot sizes, and renovation levels
  • Lifestyle focus: Central access, mature streets, and established neighborhood conditions
  • Best fit: Families, move-up buyers, and buyers comparing older homes outside the most restrictive historic areas

Verify me: Community boundaries, HOA status, historical details, and school assignments should be checked for each property.

Historic Mission-style courtyard and landscaped walkway in San Juan Capistrano

Tier 2: Gated Luxury Communities 🔐

Marbella

  • Setting: Guard-gated golf and country club community
  • Property profile: Custom and luxury single-family homes, with variation by golf, hillside, and interior location
  • Lifestyle focus: Golf, privacy, controlled access, views, and club amenities
  • Best fit: Buyers seeking a premium gated setting with recreational and social amenities

The Hunt Club

  • Setting: Guard-gated equestrian estate community
  • Property profile: Custom residences, large parcels, and potential horse facilities
  • Lifestyle focus: Privacy, horses, land, and estate living
  • Best fit: Buyers who need equestrian functionality and a private residential environment

Hidden Mountain

  • Setting: Gated hillside community
  • Property profile: Custom homes with elevated locations and potential canyon or city views
  • Lifestyle focus: Privacy, architecture, views, and separation from busier streets
  • Best fit: Buyers prioritizing custom design and hillside privacy

Capistrano Royale

  • Setting: Established gated residential community
  • Property profile: Detached homes with varied floor plans, lot positions, and updates
  • Lifestyle focus: Controlled access and a quieter neighborhood setting
  • Best fit: Buyers seeking gated living without necessarily requiring an estate-sized property

Peppertree Bend

  • Setting: Hillside enclave of custom estates near San Juan Creek Road and the Del Obispo area
  • Property profile: Approximately 44 custom single-family estates, typically on one-acre-plus lots
  • Lifestyle focus: Privacy, space, panoramic ocean and hillside views, and resort-style outdoor amenities
  • Best fit: Buyers seeking a small, private custom-home enclave rather than a large amenity community

Mission Hills Ranch

  • Setting: Gated equestrian-oriented community
  • Property profile: Larger homes, estate parcels, and potential equestrian improvements
  • Lifestyle focus: Horses, privacy, land, and a ranch-style environment
  • Best fit: Buyers who want gated access combined with equestrian or large-lot features

Verify me: Community-level price ranges, HOA dues, gate services, club memberships, equestrian rules, and historical details are property- and association-specific. Confirm current documents before relying on them.

San Juan Capistrano luxury estate with warm exterior lighting and landscaped grounds

Tier 3: Equestrian and Large-Lot Living 🐎

Sun Ranch

  • Setting: Larger-lot residential and semi-rural area
  • Property profile: Homes with usable land and potential equestrian improvements
  • Lifestyle focus: Outdoor space, privacy, and low-density living
  • Best fit: Buyers seeking room for animals, gardens, recreation, or accessory uses

Los Corrales

  • Setting: Large-lot and equestrian-adjacent area
  • Property profile: Detached homes, parcels, and properties with outdoor facilities
  • Lifestyle focus: Land, horses, and a less compact residential environment
  • Best fit: Buyers who value usable acreage over planned-community amenities

Rancho Madrina

  • Setting: Estate-oriented community with equestrian-adjacent and newer-construction characteristics
  • Property profile: Larger homes, private lots, and select newer residences
  • Lifestyle focus: Space, privacy, and access to open surroundings
  • Best fit: Buyers comparing estate living with newer construction options

Mission Hills Ranch and Peppertree Bend

These communities also belong in the large-lot category because their value may depend on land usability, privacy, access, and permitted improvements, not only the residence itself.

Equestrian Buyer Checklist ✅

Before purchasing, review:

  • Horse zoning and permitted uses
  • Stable and barn condition
  • Trailer access and turning areas
  • Usable flat areas
  • Arenas and turnouts
  • Fencing and gates
  • Drainage and grading
  • Water access and utility capacity
  • Trail access and recorded easements
  • Permits for existing structures

Large-lot San Juan Capistrano equestrian property with riding arena and landscaped grounds

Verify me: A property that appears suitable for horses may have zoning, HOA, access, drainage, or infrastructure restrictions.

Tier 4: Coastal-Adjacent and Newer Construction 🌿

Belle Cliff at Pacifica San Juan

  • Setting: Newer residential community within Pacifica San Juan, near coastal-adjacent South Orange County amenities
  • Property profile: Newer attached or detached residences, depending on the specific phase and listing
  • Lifestyle focus: Modern floor plans, community design, and lower-maintenance living
  • Best fit: Buyers seeking newer construction and a planned-community environment

Verify me: Construction phase, HOA dues, amenities, property type, and exact community boundaries should be confirmed in current listing and association documents.

Rancho Madrina

Rancho Madrina also fits this tier when a buyer’s priority is newer construction, larger living spaces, and a private setting rather than historic character or traditional equestrian facilities.

Tier 5: Family and Value-Oriented Communities 👨‍👩‍👧‍👦

San Juan Hills

  • Setting: Established residential area with multiple subdivisions, including gated sections
  • Property profile: A mix of single-family homes, townhomes, and condominiums across subdivisions including Mesa Vista, Loma Vista, and San Juan Hills East and West
  • Lifestyle focus: Residential streets, varied housing choices, central access, and select view-oriented locations
  • Best fit: Families, move-up buyers, and 55+ buyers seeking more space or lower-maintenance options without estate-level requirements

Village San Juan

  • Setting: Established townhome and attached-home community
  • Property profile: Townhomes, condominiums, and smaller residences
  • Lifestyle focus: Lower-maintenance ownership and an accessible entry point
  • Best fit: First-time buyers, downsizers, and buyers prioritizing value or manageable upkeep

Established Del Obispo-Area Neighborhoods

  • Setting: Central residential area near everyday services and transportation
  • Property profile: Older detached homes with varied sizes and condition
  • Lifestyle focus: Convenience, established streets, and practical family living
  • Best fit: Buyers seeking a central home with more traditional neighborhood character

Verify me: HOA fees, assessments, community boundaries, price ranges, school assignments, subdivision details, and 55+ age restrictions vary by tract and should be confirmed by address.

Historic-Area Buyer Checklist 🧾

If you are considering Los Rios, Mission Flats, or another older central property, review:

  • Historic overlay and preservation restrictions
  • Lot size and setbacks
  • Permitting history
  • Renovation scope
  • Structural and systems condition
  • Roof, plumbing, electrical, and drainage
  • Potential limits on additions or exterior changes

Historic character can be valuable, but the property should be evaluated for both ownership goals and improvement requirements.

Schools and Assignments 🎓

Capistrano Unified School District serves San Juan Capistrano. Verify me: School boundaries, attendance assignments, enrollment procedures, and program availability can change by address and school year. Confirm directly with Capistrano Unified School District before relying on school information in a purchase decision.

Buyer Takeaways for 2026 🔎

  • Treat San Juan Capistrano as multiple smaller markets, not one median-price market.
  • Compare properties by community, lot size, condition, use, and amenities.
  • Review HOA documents, permits, disclosures, zoning, and recent comparable sales.
  • Expect stronger competition for well-priced historic, gated, equestrian, and newer homes.
  • Use current sold data before making an offer. Browse recently sold listings.

Seller Takeaways for 2026 📈

  • Your community matters more than the citywide median.
  • A historic home, townhome, equestrian estate, and gated custom property require different comparable sales.
  • Price decreases on approximately 41% of Altos-tracked listings show that buyers remain value-focused.
  • Prepare documentation for permits, HOA requirements, horse facilities, improvements, and property condition.
  • Request a free San Juan Capistrano property valuation before setting a list price.

Search San Juan Capistrano Homes for Sale 🏠

Begin with the San Juan Capistrano homes for sale search and filter by price, bedrooms, bathrooms, property type, and purchase type.

MLS information should be independently verified. Prices, status, property details, and availability can change without notice.

Walker Real Estate Group is available 24/7 to help you compare San Juan Capistrano communities, review active listings and sold data, and plan your next step. From your first property search or valuation request through negotiations, inspections, escrow, and closing, you can receive ongoing support and personalized guidance. 🤝

Sept. 14, 2026

San Clemente Luxury Homes

San Clemente Luxury Market Update • September 14, 2026

30 San Clemente Luxury Homes For Sale Right Now

From a nearly three-acre oceanfront compound on Calle Isabella to a guard-gated estate in Marbella, here's a curated look at San Clemente's top luxury listings on the market today — presented by Chris Walker of Coldwell Banker Realty.

San Clemente's luxury market remains one of the strongest in Southern Orange County, from clifftop oceanfront estates to guard-gated communities like Marbella and Cyprus Shore. Below is a roundup of 30 of San Clemente's top luxury listings currently for sale, sorted from most to least expensive. Whether you're searching for an oceanfront compound or a guard-gated family estate, you can browse full details, photos and more on SearchSoCalProperty.com.

Chris Walker is a 22-year veteran REALTOR at Coldwell Banker Realty with over 500 homes sold and 250 five-star Google reviews. He serves Southern Orange County, CA, including San Clemente and the surrounding coastal communities.
30Homes Featured
$3.65MStarting Price
$43MTop Price
100%San Clemente

Featured San Clemente Luxury Listings

Curious About Any of These Homes?

Every property above is available to view. Reach out to schedule a private showing, get a comparative market analysis, or start a tailored luxury search anywhere across Southern Orange County.

Chris Walker
Coldwell Banker Realty
949-370-6244 • Chris@ChrisWalkerRealEstate.com
Serving Southern Orange County, CA
Property information is deemed reliable but is not guaranteed and should be independently verified. All properties are subject to prior sale, change or withdrawal. Square footage, room counts and other details should be independently verified with the listing broker. Equal Housing Opportunity.